Automated Analysis
Overview
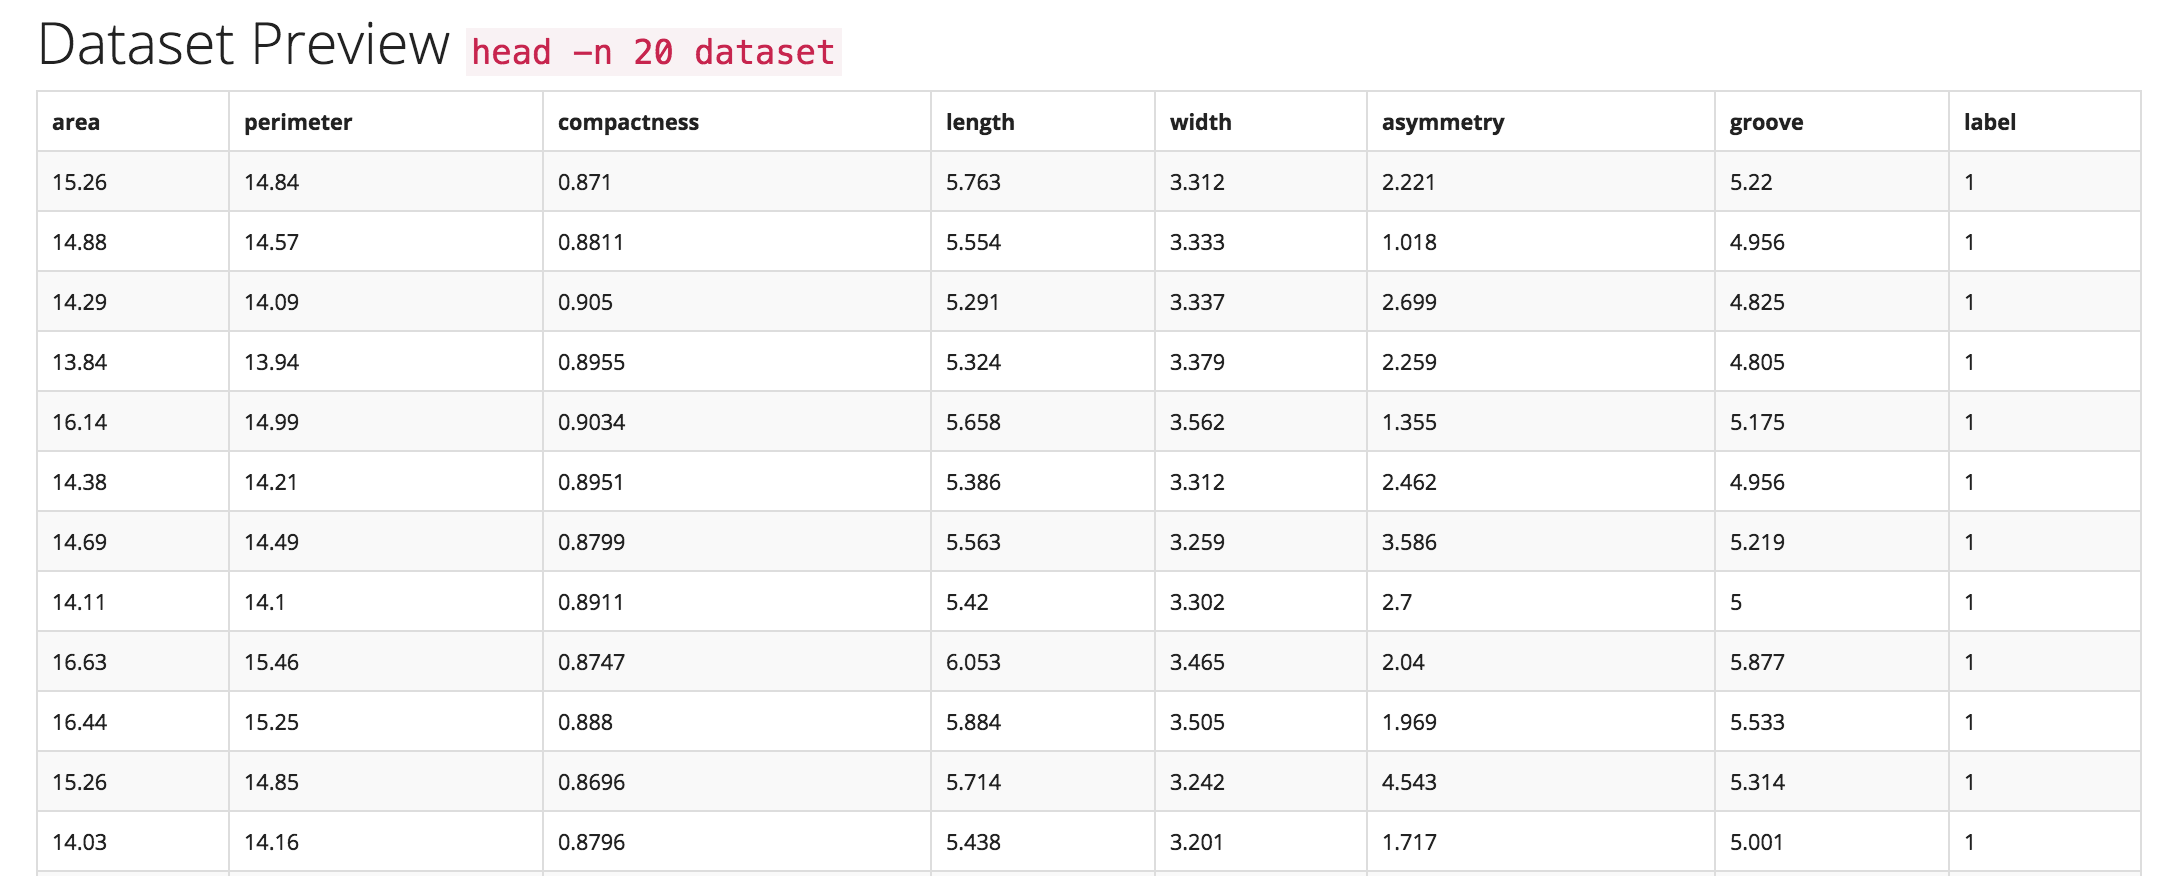
Trinket is designed to mirror what experienced data scientists do when they take their first few passes through a new dataset by intelligently automating large portions of the wrangling and analysis/exploration phases of the data science pipeline, integrating them into the initial ingestion or uploading phase.
Architecture
The auto-analysis and text parsing features of Trinket are written in Python. They work by scanning columns of uploaded data and using numpy, unicodecsv, one-dimensional kernel density estimates, standard analyses of variance mechanisms and hypothesis testing (KDEs, ANOVAs).
This enables Trinket to do type identification, e.g. to identify and differentiate: discrete integers, floats, text data, normal distributions, classes, outliers, and errors. To perform this analysis quickly and accurately during the data ingestion process, Trinket includes a rules-based system trained from previously annotated data sets and coupled with heuristic rules determined in discussions with a range of experienced data scientists.
Mechanics
Auto-analysis works by assigning each column/feature a data type (dtype in the parlance of NumPy and Pandas), e.g. categorical, numeric, real, integer, etc. These types must be automatically inferred from the dataset.
The auto-analysis method takes as input a file-like object and generic keyword arguments and returns as output a tuple/list whose length is the (maximum) number of columns in the dataset, and whose values contain the datatype of each column, ordered by column index.
Questions to answer:
-
How do other libraries like
pandasandmessytablesdo this?
Pandas computes histograms, looks for the min and max values of a column, samples quantiles, and counts unique values. -
Do you have to go through the whole dataset to make a decision?
Yes and no - decide based on how big the dataset is. The below strategy builds a sample from 50 non-empty rows for each column, as well as the rows with the longest and shortest lengths. For larger datasets, maybe sample 10%. For extremely large datasets, 1% might be enough. -
Can we use a sampling approach to reading the data? Naive method (assumes straightforward densities):
for each col in fileTypeObject:
    find mx # row with the longest value
    find mn # row with the shortest value
    find nonNaN # first 50 non-empty rows using ndarray.nonzero()
    sampleArray = nd.array(mn, mx, nonNaN)
-
Is there a certain density of data required to make a decision?
This is a good question - some libraries build histograms for each column to examine densities. See thepandasmethod for histograms. TODO: look into thresholds -
What types are we looking for? string, datetime, float, integer, boolean See also
messytablestypes.
Attempt parsing from broadest type to narrowest:
for val in colSample:
    if val.dtype.type is np.string_:
        colType = colType.astype('Sn') # where n is the max length value in col
    elif val.dtype.type is np.datetime64:
        colType = colType.astype('datetime64') # this is new & experimental in NumPy 1.7.0
    elif val.dtype.type is np.float_:
        colType = colType.astype('float64')
    elif val.dtype.type is np.int_:
        colType = colType.astype('int64')
    elif val.dtype.type is np.bool_:
        colType = colType.astype('bool')
    else:
        # do something else
        # what about unicode and complex types?
-
What does column-major mean for Trinket?
Usetransposeand/orreshapefromnumpy. -
Can we automatically detect delimiters and quote characters? (e.g. ; vs ,)
Seemessytablesmethod for delimiter detection. -
How do we detect if there is a header row or not?
Seemessytablesmethod for header detection. -
How lightweight/heavyweight must this be?
Look into making more lightweight using regular expressions & hard-coded rules (see Brill tagging).